Topographic profile (a graphical representation of a relief vertical section) will be used to make geological cross sections. A useful method to make topographic sections is to make the bottom of a sheet or strip of paper coincide with the way in which you want to build the topographic profile.
Next, you have to mark the points where paper intersects contour lines, writing down their value. You should verify that all points that have been marked correspond to a series of equidistant numbers in ascending or descending order. If there are two alike values it means that there is a change of hillslope (mountain, talweg of a river, valley or depression.)
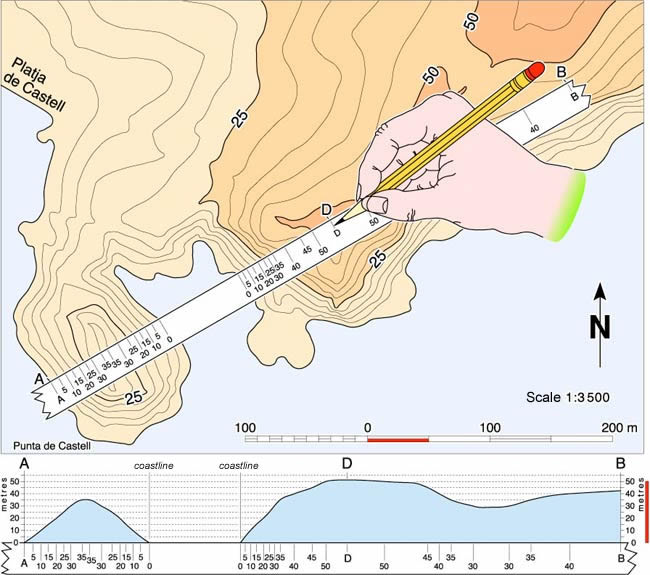
This method allows building the profile in an axis system. Before you will have to decide which scale to use. In Geology topographical profiles have the same scale in both axes (horizontal and vertical.) Horizontal axis points can be obtained writing down onto a paper strip the points where contour lines intercept the line of the profile. In the vertical axis heights of all these points will be marked according to your notes and taking in account the number of millimetres that correspond to each point following the map scale. For instance, if the scale of the map is 1:25 000 and the equidistance is 100 meters, spacing between two consecutive contour lines on the vertical axis will be 4 mm.
In order to emphasize a relief or to smooth it, you can increase or decrease, respectively, the vertical scale axis. This method is used to visualize mountain passes in a cycling race route.
It is often interesting to know the slope of a relief surface to plan its agricultural use, calculate its grade of erodibility or prevent from gravitational instabilities. Sometimes which is interesting is to know the stream slope. Slopes are trigonometric tangents of the incline angle of the stream with regard to the horizontal plane. This means that a path of 100m measured on the map allows us to cover a difference of level of 10m.
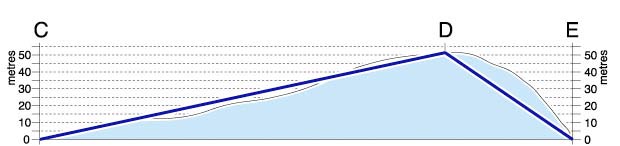
To calculate the slope between points D and E of the attached outline you should know the distance and the difference of height between them.
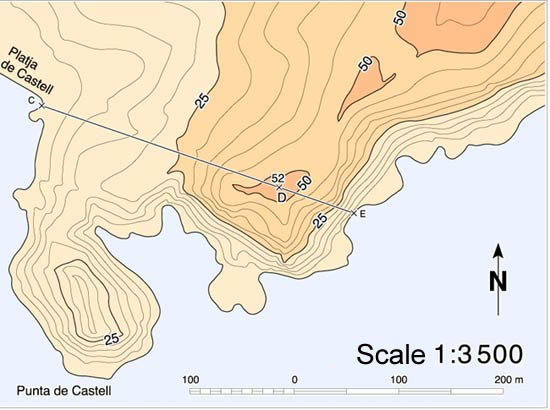
In this case elevation of D is 52m over sea level and 0m for E (coastline.) The distance between them is 75 meters, so the slope (quotient that results of dividing the difference of level between two points by the distance that separates them) will be of 69%. It is the same to say that this hillslope has an angle of 34º respect from the horizontal line. If you repeat these calculations for points C and D you will see that the slope is much smoother in this way (a longer horizontal path to cover the same difference of level.) It can be proved again that the distance of contour lines between points C and D is much bigger than between D and E.
If you have previously made the topographic section using the same scale for both the horizontal and vertical axes you will visualize this slope graphically.