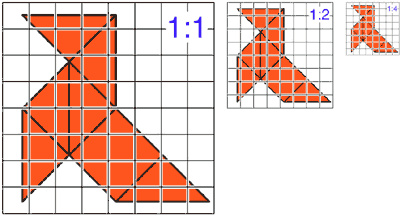
To make a topographic map (or any other kind of map) useful it must be drawn to scale. Any object or part of the earth’s surface representation is often made by reducing its size. We call scale the degree of reduction used compared to real size.
 The object on the left is represented with its real size and so it corresponds to scale 1:1 (there isn’t any enlargement or reduction.) If we want to draw it half its size (the central part of the picture) scale will be 1:2. A scale 1:4 (right) shows that we have reduced the initial figure to a fourth part.
In topographic or geological maps scale shows the existent ratio between any measure of reality and the same measure taken on the map. This ratio can be indicated either with a graphic or a numerical scale. In most of the maps both are represented.
Numerical scale is symbolized as a quotient in which the numerator is a unit and the denominator a number that indicates the level of reduction, i.e., how many times a measure is smaller than the same measure in reality. For example, the representation of a piece of land in a map has been reduced 25 000 times. This means that a unit of measure on the map (e.g. 1mm) equals 25 000 units of reality (25 000 millimetres = 25 meters.) In other words, the quotient which the numerical scale is represented with is a ratio between the represented size and the real one. This allows calculating with any unit of measurement.
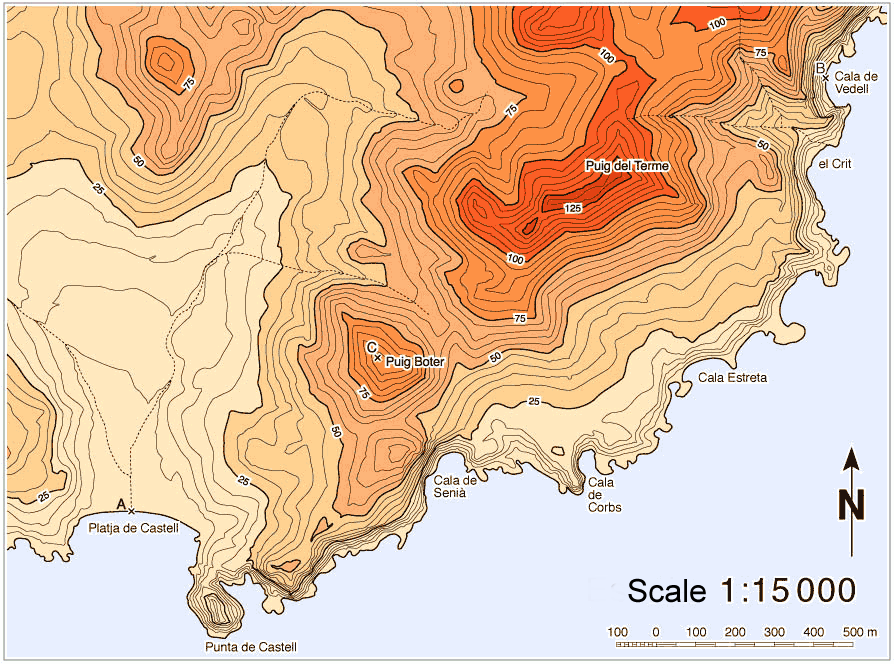
To know the distance between two points using a map and its numerical scale you have to measure the space between them on the map and multiply this number by the denominator of the numerical scale. The distance between A in the picture (the mouth of Platja de Castell brook) and C (Puig Boter) is 4,9cm. Consequently, there are 735 meters between them in reality.

The graphic scale is a line divided in segments that indicates real distances on the ground. Generally, on the left of the line there is one of the units of measurement subdivided into 10 parts, which permits to take more accurate measures.
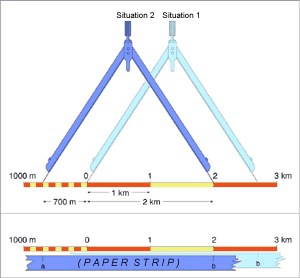
 This way of scale representation makes work easier and quicker and calculations are simpler. If you want to determine the distance between two points of the map you have to measure the space between them with a compass or a bare paper strip.
For doing it you must place the compass on the scale starting in zero (situation 1). If the other leg of the compass or the other end of the paper strip does not match with an exact division of the graphic scale you must make a leg of the compass coincide with the nearest division. Thus, the other leg will allow taking more exactly measures (situation 2). In this case, the compass estimates two large divisions of the graphic scale and seven small divisions: that is 2.700 meters. The same procedure can be made using a paper strip.
The larger the scale is (or the smaller the denominator is) the larger the paper surface to represent will be. In consequence, geographic accidents or any other aspect could be represented in more detail. In other words: with the same map or paper surface you have more or less area of land represented depending on the scale.
And the other way round, the smaller the paper surface needed is, the smaller the scale is. The map will be much more condensed.
To better understand there is a very suggestive example in everyday life: television can be watched with different size screens, but all of them show the same image. When you change the TV size you also change the scale of the image.
